
[box_dark]
‘MAPPING’ SEOUL IN THE 1930s
Colonial cartography offers fascinating insights into a dark period in the capital’s history
Written by Robert J. Fouser
Images courtesy of author
Historians know the power of maps as research tools. They know that maps, like other types of historical documentation, are accurate not in the absolute, but as reflections of society at a given point in time. Maps tell how space was organized in the past and how people defined it, giving information that helps develop, along with many other sources, the “story of the past.”
Maps of Seoul in the 20th century document the tremendous changes the city experienced in those 100 years. Amid the torrid climate of change, two periods stand out: the 1930s and the 1970s. These two decades brought rapid changes in maps, as city planners responded to surging population growth that began in the previous decades. From 1920 to 1940, the population jumped from 253,000 to 1,110,000; from 1960 to 1980, it jumped from 2,445,000 to 8,364,000. This explosive growth overwhelmed the city infrastructure at both times.
Colonial administration
Of the two periods, the 1930s are particularly interesting because it brought great change to the historic heart of Seoul, producing the urban paradigm that lasted until the 1970s when the Gangnam area was developed based on apartments and wide roads. Decisions about planning in the 1930s, of course, were in the hands of Japanese colonial rulers who looked to administrative centers in Japan for ideas. By 1940, Seoul, or Gyeongseong (Keijo in Japanese), as they called it, was the fifth largest city in Imperial Japan, ranking between Kyoto and Yokohama.
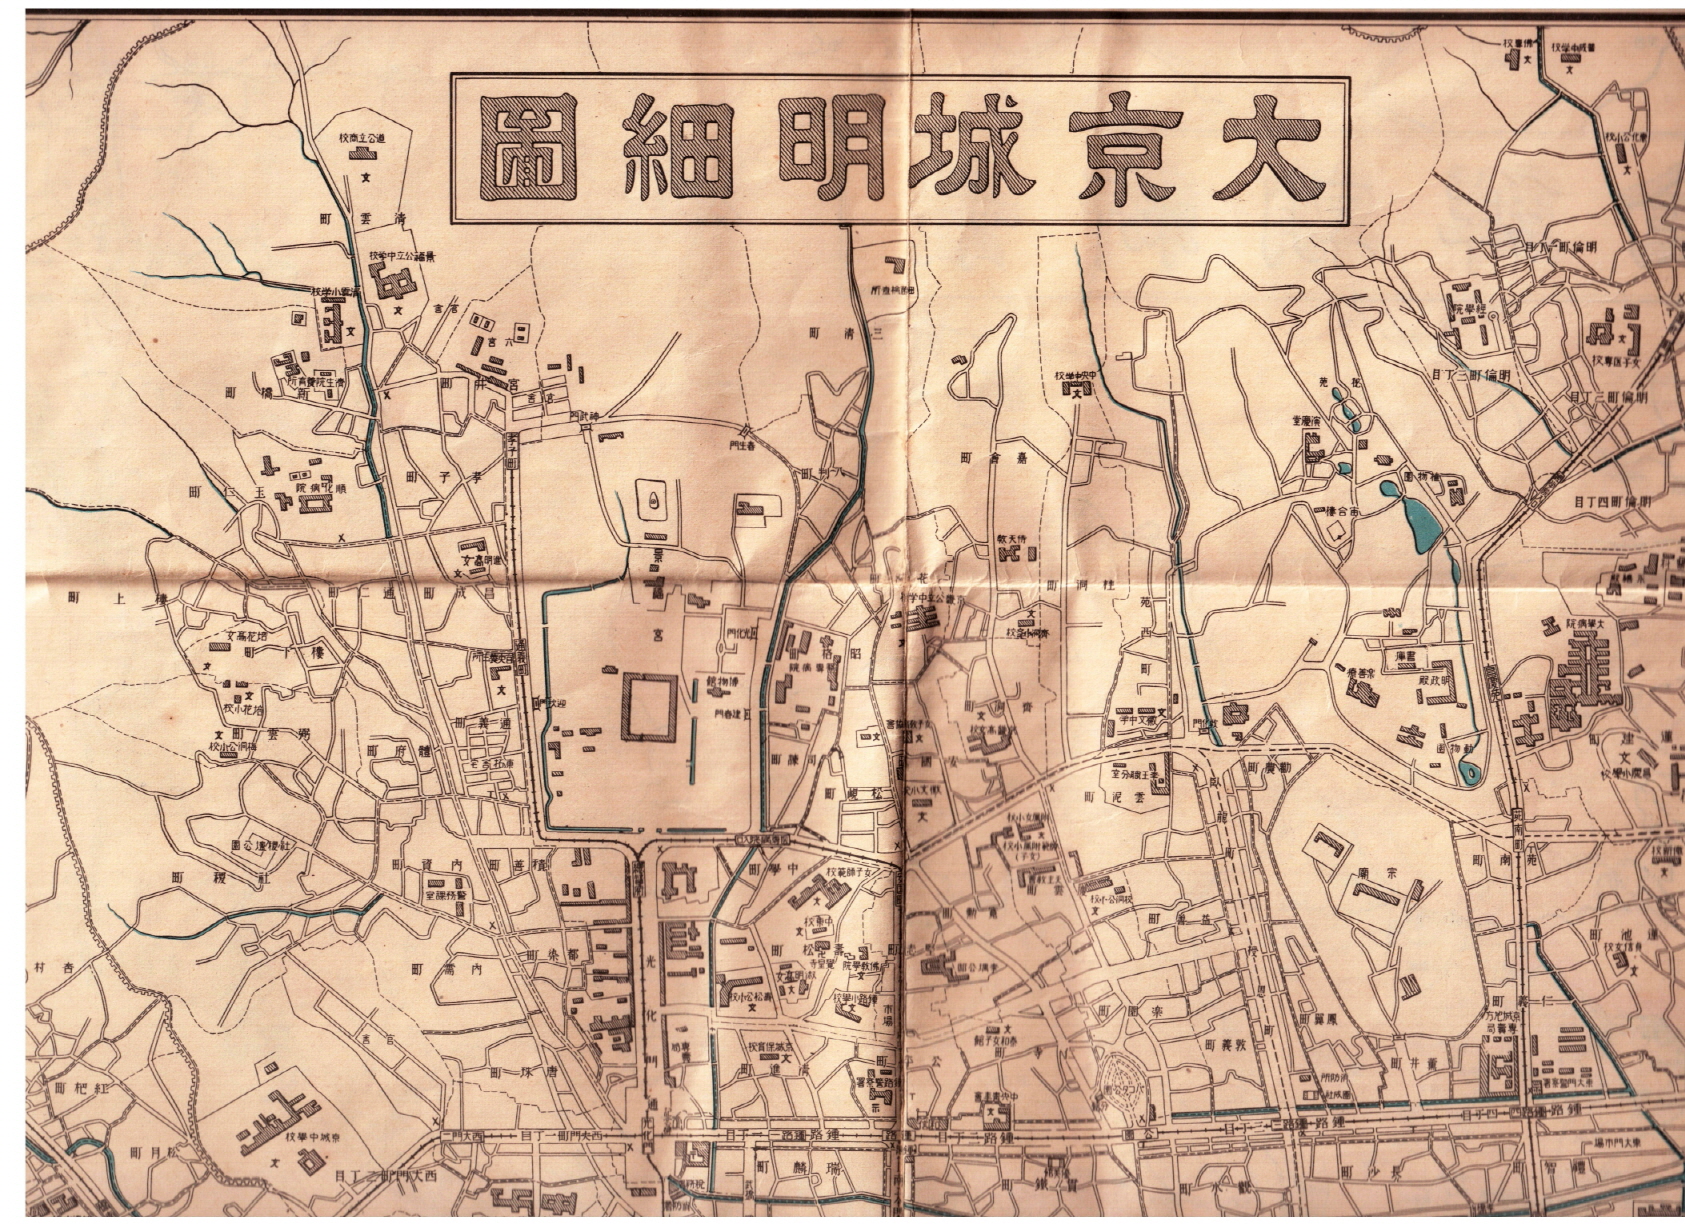
A map printed from the early 1930s says much about Seoul after a decade of growth in the 1920s. Areas of grey dots and the largely intact Seoul Wall are most noticeable. The grey dots indicate urban areas and fill most of the area inside the wall, but also expand to the south and west, areas that developed after the Japanese destroyed the city wall. Itaewon was the center of the Japanese military and was secluded from the rest of the city by Mt. Namsan and the hills in what are now Hannam-dong and Yaksu-dong.
Dissolving social classes
Of particular interest are the white spaces in the Bukchon area. Anguk-dong and areas closer to Gyeongbokgung Palace were dense, but Gahoe-dong and Gye-dong, popular tourist spots today, were largely white space. By contrast, Seochon, the area on the other side of the palace, was more densely developed. The streetcar line running along the west side of the palace and larger areas of flat land help explain the difference at this time.
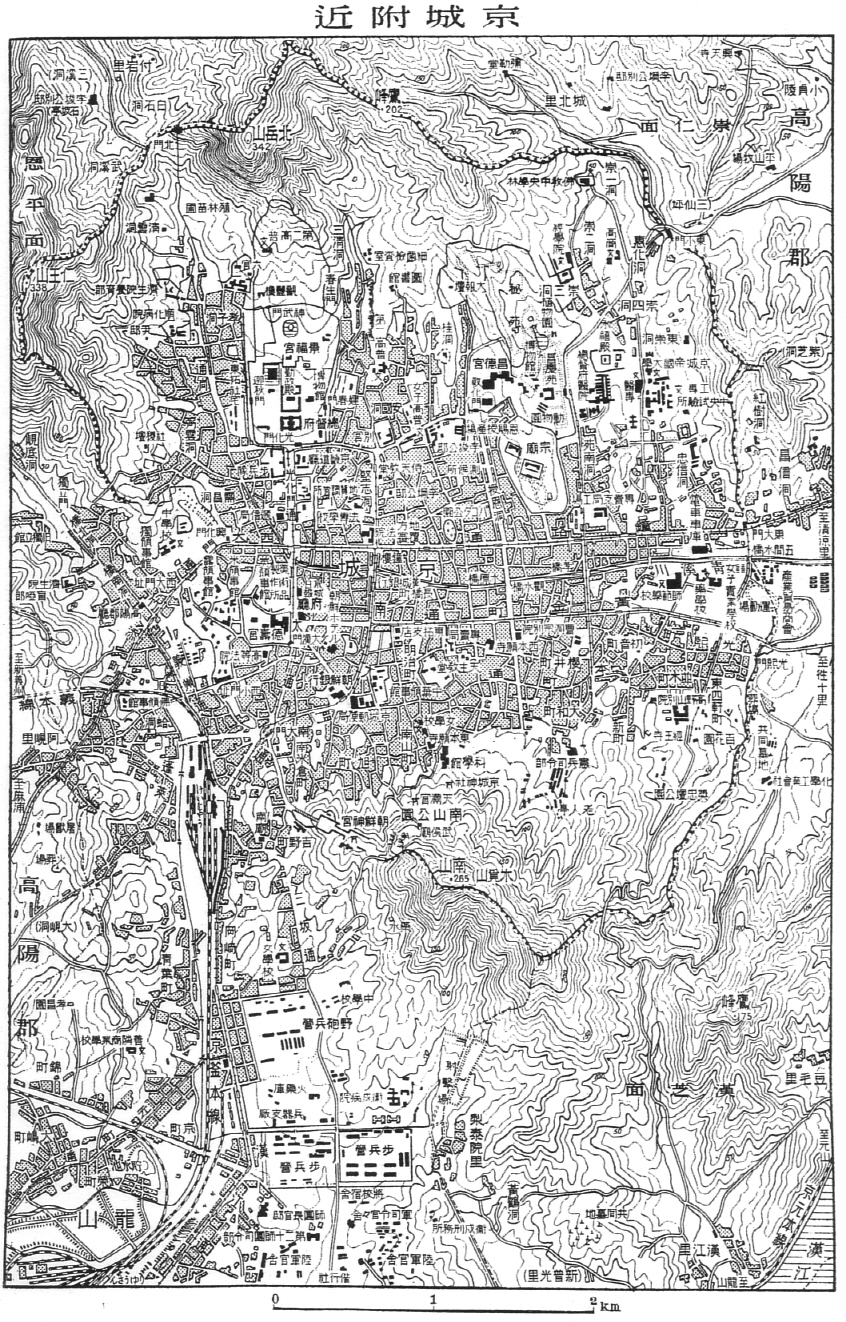
A map printed in the late 1930s shows many of the changes that took place in that decade. Rapid development of Gahoe-dong and Gye-dong occurred in the mid-1930s and this map show more streets and alleys. The collapse of Joseon society after Japanese colonial rule began in 1910 gradually impoverished the aristocratic families that had lived in Bukchon. By the 1930s, they were forced to sell their large estates, which were divided into smaller lots for the densely packed rows of Koreanstyle city houses, or “city hanok.”
Increasing urban spread and Japanization
By the late 1930s, the city had filled in the area inside the walls and had spread well beyond them. In the earlier map, Daehak-ro and Hyehwa-dong were white space, except for Gyeongseong Imperial University, the forerunner of Seoul National University. By the end of the decade, the area was full of roads and alleys. Part of the city wall near Dongdaemun had been destroyed, and two street car lines expanded east. Earlier growth in Yongsan had spread to Mapo, and the map showed Noryangjin, one of the first areas on the south side of the Han River to be urbanized. Noryangjin and Yeongdeungpo, the first primary industrial areas of Seoul, were incorporated into the city in 1936 (Yeouido was a swamp and not shown on most maps).
The growth of Seoul in the 1930s also reflects the weight of efforts to “Japanize” Ko r e a . The earlier map gave local neighborhood names for areas in northern half of the city in Korean (“dong”) and in Japanese (“cho”) for areas in the southern half. This reflects the pattern of settlement that emerged during the colonial period in which Japanese dominated the southern half of the city and Koreans the northern half. In the map from the late 1930s, all of the neighborhoods are given in Japanese, which reflects the “Japanization” of the city both as policy and as demographics.
Reading maps of Seoul in the 1930s shows a city changing from a compact administrative center to a large metropolis with a diverse economy. These maps also show the extent of colonial oppression and stand as reminders of the struggle for ownership of history that continues in Korea to this day.

")


